1 Overview
1.1 Survey Sampling
To evolve and adapt, human make observations and identify patterns, from animal behaviors to hunt in our early days, to physical laws of the universe in the modern world. In these processes, we collect data from instances and try to generalize them into principles or conclusions that can be applied in other cases. Statistics is the branch of mathematics that studies such a process, namely data collection, analysis, and interpretation.
Survey sampling is one of the fundamental subjects in statistics. In survey sampling, we are often interested in learning about a parameter of a target population. To understand what this means, we introduce some definitions:
Observation unit: An object on which a measurement is taken.
Variable of interest: The types of measurement taken on observation units that we want to study.
Target population: The complete collection of observation units we want to study. This is also the collection of units that we want to make conclusions about.
Parameter: A quantity that can be calculated from the variable of interest of the target population.
Example 1.1 To better understand the above terminologies, let us consider an example where we are interested in how much students pay for rent. We will use this example throughout the book to illustrate different concepts in survey sampling.
In this example, the variable of interest is the monthly rent expense. The observation units are students because we will “measure” their rent expenses.
If we want to study the rent expense of all students in Canada, then our target population is all students who enroll in a Canadian university. A less ambitious target population is the student body of University of Saskatchewan.
The parameter of our interest can be the average rent expense or the total dollar amount of rent paid by all students in the target population.
Example 1.2 Another example is when an agricultural researcher want to estimate the yield of a crop. To do this, the researcher may want to grow that crop on multiple plots of land. The observation units are plots of land because we will “measure” the yield of a crop on those plots.
Because the crop may have different yields at different environmental conditions, the possible target populations can be defined by locations. The researcher may want to get an estimate of the yield in the city of Saskatoon, or they want to get an estimate of the yield in the province of Saskatchewan, or a more ambitious goal will be the whole Canada. The parameter of our interest can be the average crop yield per acre.
In survey sampling, we often assume that the population is finite1, and consists of \(N < \infty\) observation units. The population size \(N\) is also assumed to be fixed, although this assumption rarely holds in reality.
Example 1.3 In 1.1, the USask student body may change every semester as current students graduate and new students enroll. This is a violation of the fixed population size assumption. On the other hand, the assumption may hold if we consider the whole student body in a fixed semester.
1.2 Census vs. Samples
1.2.1 Census
To understand about the parameter of interest, we may try to collect data about every single observation unit in the target population. This is called a census.
With a census, you can calculate the parameter of interest directly.
A census also provides information on every subpopulation, no matter how small.
Example 1.4 If we know the rent expense of every single student at USask, we will be able to calculate their average monthly rent expense directly. We will also be able calculate the average rent expense of every groups of students, for example, we will know the average students’ rent in every department.
Notes: Many countries have censuses of birth and death records. In particular, Canada collect census data about its population every five years, often by sending invitation letters to all dwellings in Canada. Check out more information about Canadian censuses here.
1.2.2 Samples
In many cases, due to constraints in cost, time, and other reasons, a census may not be possible. In this case, we may collect sample data.
Sample: A subset of a population.
Sampled population: The collection of all possible observation units that might have been chosen in a sample. This is the population from which the sample was taken.
- In practice, the sampled population rarely coincide with the target population (see Figure 1.1).
Sampling unit: The unit that can be selected for a sample.
- Sometimes we want to study individuals but do not have a list of all individuals in the target distributions. In this case, the sampling unit may differ from the observation unit.
Sampling frame: A list, map, or other specification of sampling units in the population from which a sample may be selected.
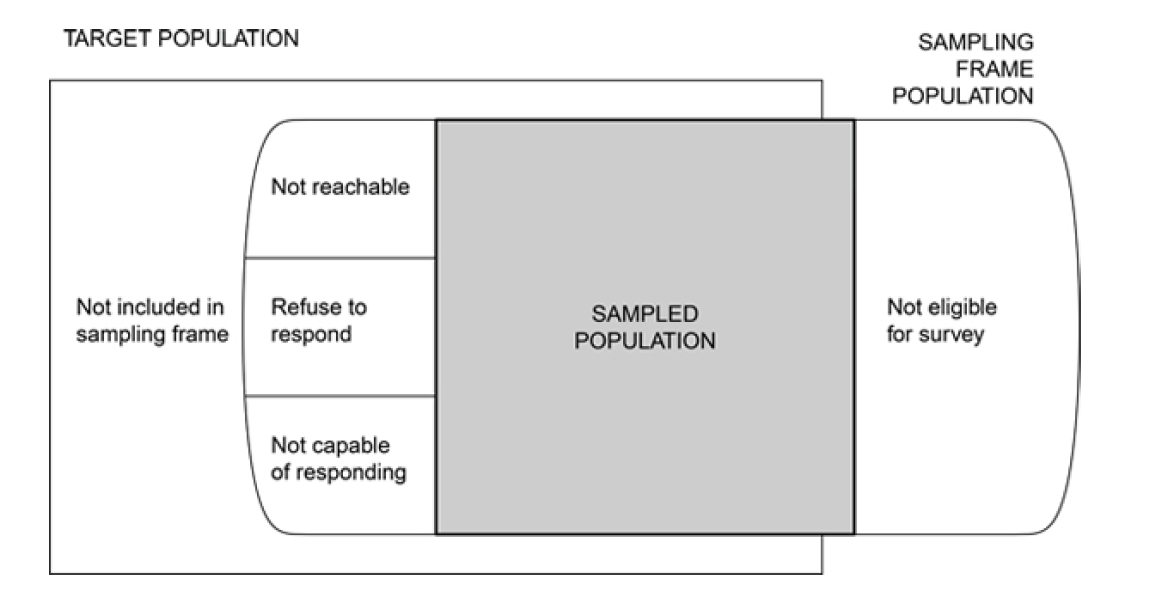
Figure 1.1: Population and sample, from Figure 1.1. of Lohr (2021).
Statistic: A quantity that can be calculated from the sample.
We can use statistics to estimate or make conclusions about the population parameter. This process is called inference.
In the next few chapters, we will consider (i) different sampling methods, then learn about (ii) how to make inferences for each of those sampling methods.
Example 1.5 In the students’ rent example, we may decide to go to several randomly chosen classes on campus to interview students about their rent expenses. Here, the sampling frame is the list of all USask classes held this semester, and the sampling units are USask classes, instead of individual students.
The sampled population are students who attend classes on the day we conduct our interviews. This excludes remote students, or thesis-writing students, for example.
The sample is the actual students who were interviewed by us. The statistic can be the average rent payments made by these specific students.
Since samples are much smaller than censuses, data collection for samples are often conducted with more care and precision. Thus, if samples are collected in an appropriate manner, inferences from samples can be even more reliable than censuses.
1.3 Variability and Bias
A sampling protocol is a plan to collect sample data. Before learning different sampling method to devise a sampling protocol, we introduce the the concepts of variability and bias to identify what makes a good sampling protocol.
1.3.1 Variability
In most cases, the list of observation units included in a sample is random, intentionally or not. The sample-to-sample difference (under the same sampling protocol) is called the variability of the sampling protocol. A sampling protocol with low variability is a sampling protocol with high precision.
Example 1.6 Suppose I randomly choose one neighborhood in Saskatoon and then ask students in that neighborhood about their rent. In this case, my sampling protocol will have a high variability or a low precision.
This is because if I repeat this same sample collecting method for many times, every time I may interview students living in a different neighborhood. Since rent will depend on specific neighborhoods and their distances to school, the rent data I collect will tend to be substantially different from one sample to another.
1.3.2 Bias
The difference between the population data and the average of different samples (coming from the same sampling protocol) is called the bias of the sampling protocol. Small bias means high accuracy. Bias is often caused by systematic differences between the target population and sample.
Example 1.7 Suppose I only interview female students. Even if I repeat this same sample collection method many times, I will only get the data that tells me about the rent expense for female students. This data will likely be different from the rent expense for all students. Hence I say the bias is high and accuracy is low.
Figure 1.2 summarizes concepts about bias, variance, accuracy and precision.
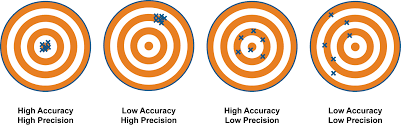
Figure 1.2: Accuracy and precision.
Because we want to get an accurate and precise estimation of the population parameter, good sampling protocol should have low variance and low bias. You will learn from this course that we are usually able to reduce the variability by choosing an appropriate sampling method. On the other hand, bias is a much harder and more subtle problem to deal with. In practice, it can be even impossible to avoid bias.
1.4 Sources of Bias
1.4.1 Selection Bias
Selection bias occurs when
the target population does not coincide with the sampled population, or
when some population units are sampled at a different rate than intended by the investigator.
Some ways in which selection bias can occur are:
convenience samples: when researchers conduct surveys on the first subset of population units they encounter;
judgement samples: when researchers deliberately and intentionally select a “representative” sample;
self-selected samples: when the sample only consists of volunteers;
undercoverage: when the sampling frame fails to include some members of the target population;
overcoverage: when units not in the target population can end up in the sample;
nonresponse: when some members of the chosen samples do not respond.
Example 1.8 If we choose to interview our friends on their rent, because they are easier to interview, we are collecting a convenience sample. If we look at people walking on the street and use our judgement to determine who we think are spending the average rent and go to interview them, we are collecting a judgement sample. If we hang on posters around school to let students to come to us by themselves, we are collecting a self-selected sample. In all these cases, there can be systematic differences between students in our sample compared to students in the population. Our friends may have a similar spending patterns as us while other students may have different opinions. Our judgement can easily be misleading regarding who we think are paying the average rent. Finally, volunteers are usually more motivated by rewards and may have a different spending behavior compared to the rest of the students.
When we interview students by visiting classes, we may miss people who do not come to class, remote students, graduate students who are writing their theses, medical residents, and so on. This induces undercoverage. When we send out emails with rewards for students to participate in our surveys, we may also end up collecting data from people who are not eligible but are motivated by the rewards and make up their eligibility. This leads us to the overcoverage problem.
Even when we actually get to interview a student, they may choose not to disclose their information. These students can be more private and have a different rent selection than the ones who reply to our interviews. Here, we run into a nonresponse problem.
1.4.2 Measurement Errors
Measurement errors occur when the survey response has a tendency to differ from the true value. When such tendency is in one direction, we have measurement bias. Measurement errors can be caused by
inaccuracy of measurement tools or devices
unreliable respondents:
- people sometimes do not tell the truth
- people forget
- people do not always understand the questions
etc.
Example 1.9 In the crop yield case of Example 1.2, plants on adjacent plots can be counted twice, inducing measurement errors.
Therefore, when conducting surveys, we should pay attention to our sampling protocol so that we get responses or measurements as accurate as possible.
For surveys that require a measurement tool or device, such an equipment needs to go through a thorough reliability check before the survey is rolled out.
When designing questionnaires to survey individuals, we should pay attention to details that may influence respondents’ responses, such as the order and wording of the questions, the list of options provided, the attitude of the interviewers, etc. For a quick guide on questionnaire design, check this tutorial.
This is called the finite population assumption.↩︎